When analyzing any set of data—whether it’s student marks, blood pressure readings, or customer reviews—two things are key:
– Where the data centers (Mean)
– How the data spreads (Standard Deviation)
Let’s break them down simply.
What is Mean?
The Mean is the average—the central value of the dataset.
✅ Formula:
Mean = Sum of all values / Number of values
🧠 Example:
For scores: 70, 80, 90
Mean = (70 + 80 + 90) / 3 = 80
This value shows the ‘center’ of the data.
What is Standard Deviation?
Standard Deviation (SD) shows how spread out the values are from the mean.
– A low SD means values are tightly packed around the mean.
– A high SD means values are more spread out.
✅ Formula:
SD = sqrt[ Σ(xᵢ – x̄)² / n ]
🧠 Example:
– Data A: 48, 49, 50 → SD is low
– Data B: 30, 50, 70 → SD is high
Even though both have the same mean, B is more scattered.
Visual Example
Below is a normal distribution graph for a dataset with:
– Mean = 50
– Standard Deviation = 12
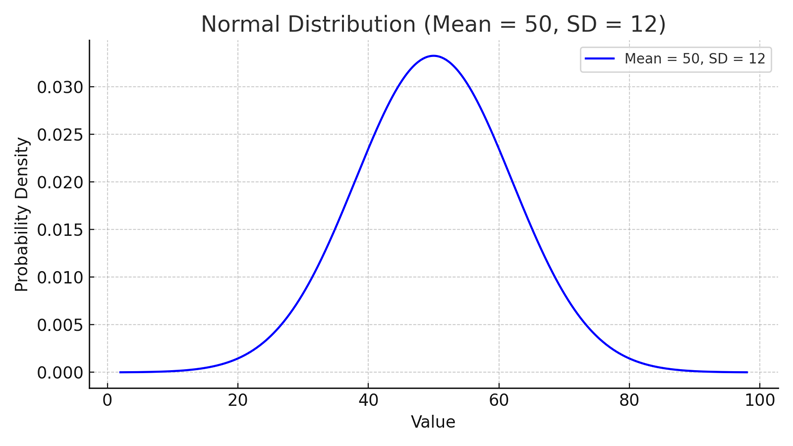
🔍 As you can see:
– The center peak is at 50 (mean)
– The spread of the curve is defined by SD = 12 (Most values lie between 38 and 62)
Summary Table
| Concept | Meaning | Role in Graph |
| Mean | Central value of data | Center of bell curve |
| Standard Deviation | Spread of data from the mean | Width of the bell curve |